
Hareketli Ortalamaların Kullanım Amaçları
Coffee Break Letters #010 - 04.06.2024


Herkese merhaba,
Hareketli ortalama (HO), teknik analistler tarafından kullanılan en eski araçlardan biridir. Finansal enstrümanlardaki günlük dalgalanmalar oldukça geniş periyotlarda olabilir. Hareketli ortalamaların kullanılmasının başlıca nedeni, bu dalgalanmaları yumuşatmak ve yatırımcının vadesine en uygun trende odaklanmasını sağlamaktır. Eğer bir teknik analist olarak grafiklerinizde hareketli ortalama kullanmaya karar verdiyseniz, en etkili şekilde HO'dan yararlanabilmek için cevaplarını vermeniz gereken 3 temel soru şu şekildedir:
Hangi hareketli ortalama çeşidini kullanmalıyım?
Kaç periyot hareketli ortalama kullanmalıyım?
Hareketli ortalama ya da ortalamaları hangi amaçla grafiğime ekledim?
Bu soruların cevaplarını tabii ki ne bende ne de başka bir teknik analistte bulamayacaksınız. Her zaman olduğu gibi olay yine kendi stratejinize en uygun cevapları verebilmekten geçiyor.
1. ve 2. soruların üzerinde çok fazla durmak istemiyorum çünkü internette ve kitaplarda bu konularla ilgili sınırsız kaynaktan bilgi bulabilirsiniz. Burada söyleyeceklerim kısaca şunlardır: Hangi HO çeşidini kullanmalıyım? Sorusu için cevap, sizin stratejinize göre zaman serisindeki hangi verilerin daha fazla önem arz ettiğini belirlemekten geçer. Örneğin, 10 periyotluk bir HO'da son 2-3 güne ait verilerin sizin için daha fazla önem taşıdığını düşünüyorsanız, hesaplama yönteminde bu son günlere ağırlık veren HO çeşidini kullanmanız gerekir. Ya da bütün verilere eşit ağırlıkta önem veriyorsanız, basit HO işinizi görecektir. Burada en önemli konu bir HO çeşidini kullanmaya karar vermeden önce onun hesaplama yöntemini en iyi şekilde öğrenmektir. Nereden geldiğini, nasıl hesaplandığını bilmediğiniz bir çizgi ile grafiklerinizi kirletmek size hiçbir fayda getirmeyecektir. Kaç periyot HO kullanmalıyım? Sorusu için ise cevap sizin trade stratejinizde saklı. Hangi vadede işlem yapıyorsanız, o vadeye uygun bir ortalama belirlemek sizin göreviniz. Piyasada genelde kullanılan ortalamalar şu şekildedir:
Kısa vade: 5-20 periyot
Orta vade: 10-50 periyot
Uzun vade: 50-200 periyot
Gelelim benim asıl detaylandırmak istediğim konuya. 'Hareketli ortalama ya da ortalamaları hangi amaçla grafiğime ekledim?' Buraya kadar bahsettiğim konularda yaptığınız seçimlerin her birinin avantajları ve dezavantajları olsa da, sizde taktir edersiniz ki asıl ilgi alanımız hareketli ortalamanın nasıl hesaplanacağı değil, para kazanmak için hareketli ortalamaların nasıl kullanılacağıdır. Hareketli ortalamalar teknik analistlere 4 temel şekilde yardımcı olurlar: Trendi Belirlemek, Destek ve Direnç Belirlemek, Aşırı Fiyat Hareketlerini Belirlemek, Al-Sat Sinyal Noktası Belirlemek.
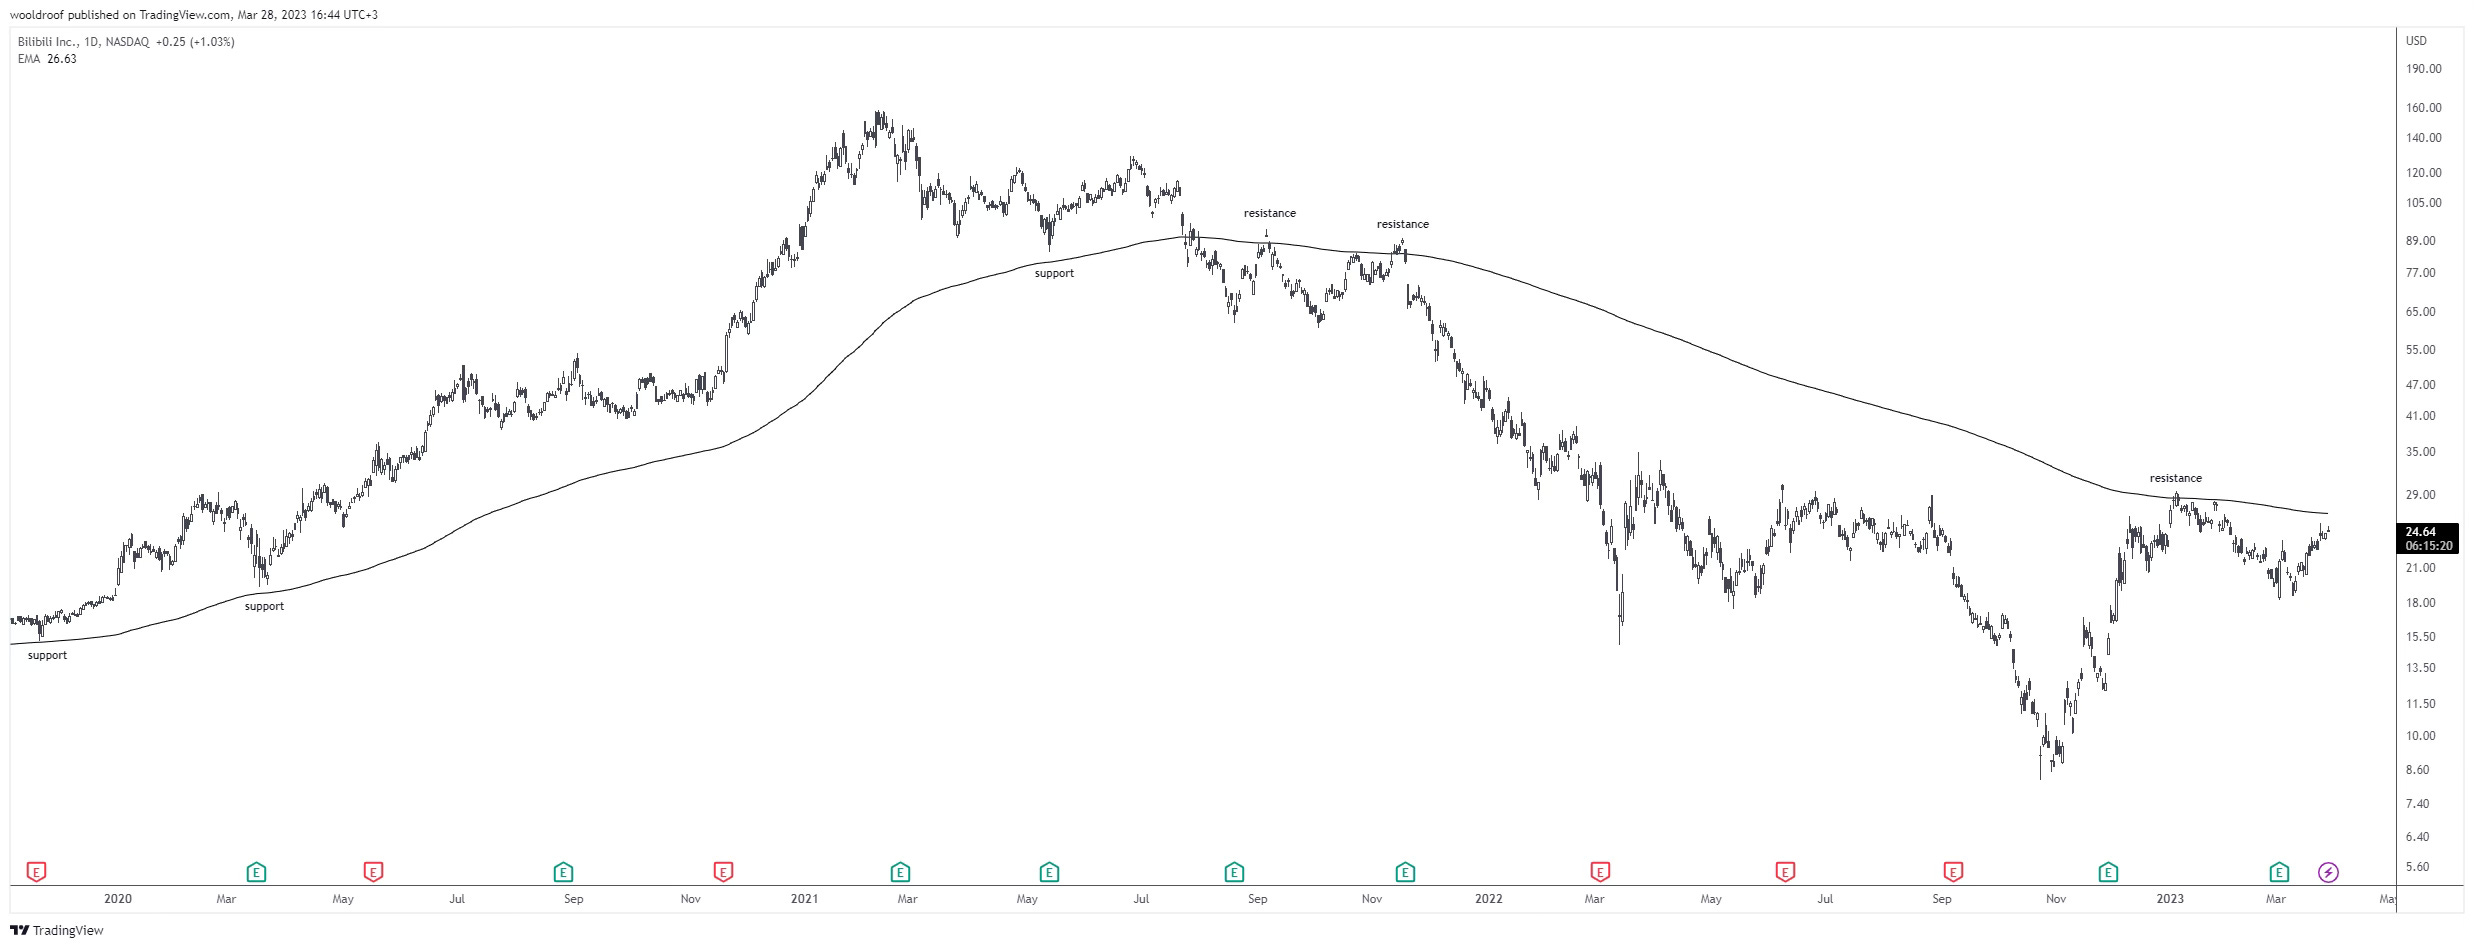
Trendi Belirlemek: En yaygın kullanımlardan biri trendi belirleme konusudur. Burada asıl amaç, mevcut fiyatı yatırımcının vadesini temsil eden hareketli ortalama ile karşılaştırmaktır. Örneğin, orta-uzun vadeli birçok yatırımcı 200 günlük hareketli ortalama kullanır. Finansal enstrümanın fiyatı 200 günlük HO'nın üzerindeyse, trend yukarı doğru kabul edilir. Tersine, finansal enstrümanın fiyatı 200 günlük HO'nın altındaysa, trend aşağı olarak kabul edilir.

Örnekteki uzun dönemli ortalamanın trendi oldukça iyi takip etme eğiliminde olduğunu görebilirsiniz. HO bir trendin potansiyel olarak ne zaman yön değiştirdiğini belirlemek için kullanılabilir. HO, bir trendi ayırt etmemize yardımcı olsa da bunu trend başladıktan sonra yapar. Bu nedenle gecikmeli bir göstergedir.
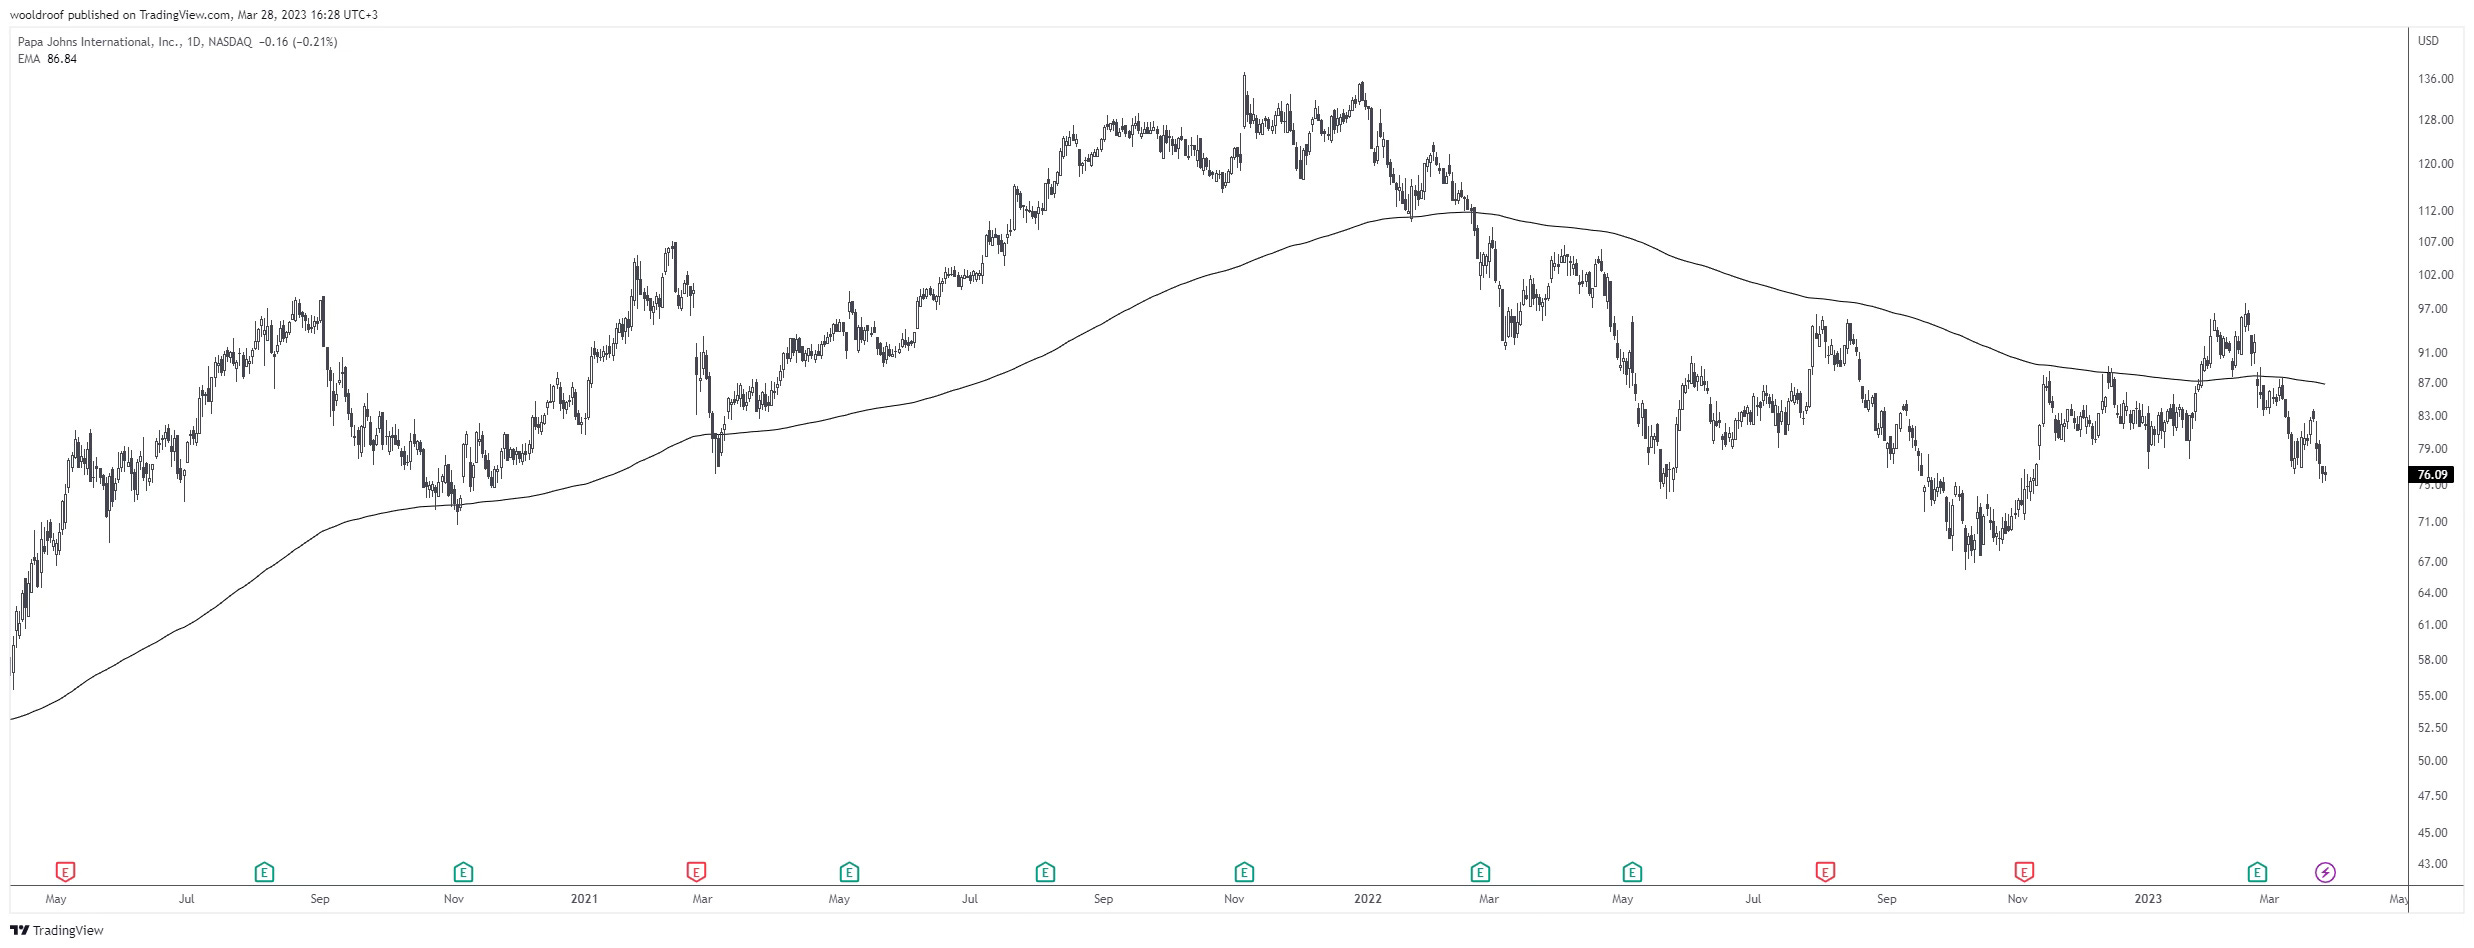
Destek ve Direnç Belirlemek: Kendi stratejinize ve vadenize en uygun HO'yı belirleyebildiyseniz, bu HO genellikle sizin sisteminizde destek veya direnç görevi görür. Örnekte uzun dönem ortalamanın nasıl destek ve direnç olarak çalıştığını görebilirsiniz. Destek ve dirençler birçok teknik analiz stratejisinin başlangıç noktası olduğu için bu bölgeleri net bir şekilde belirlemek benim için altın değerindedir.
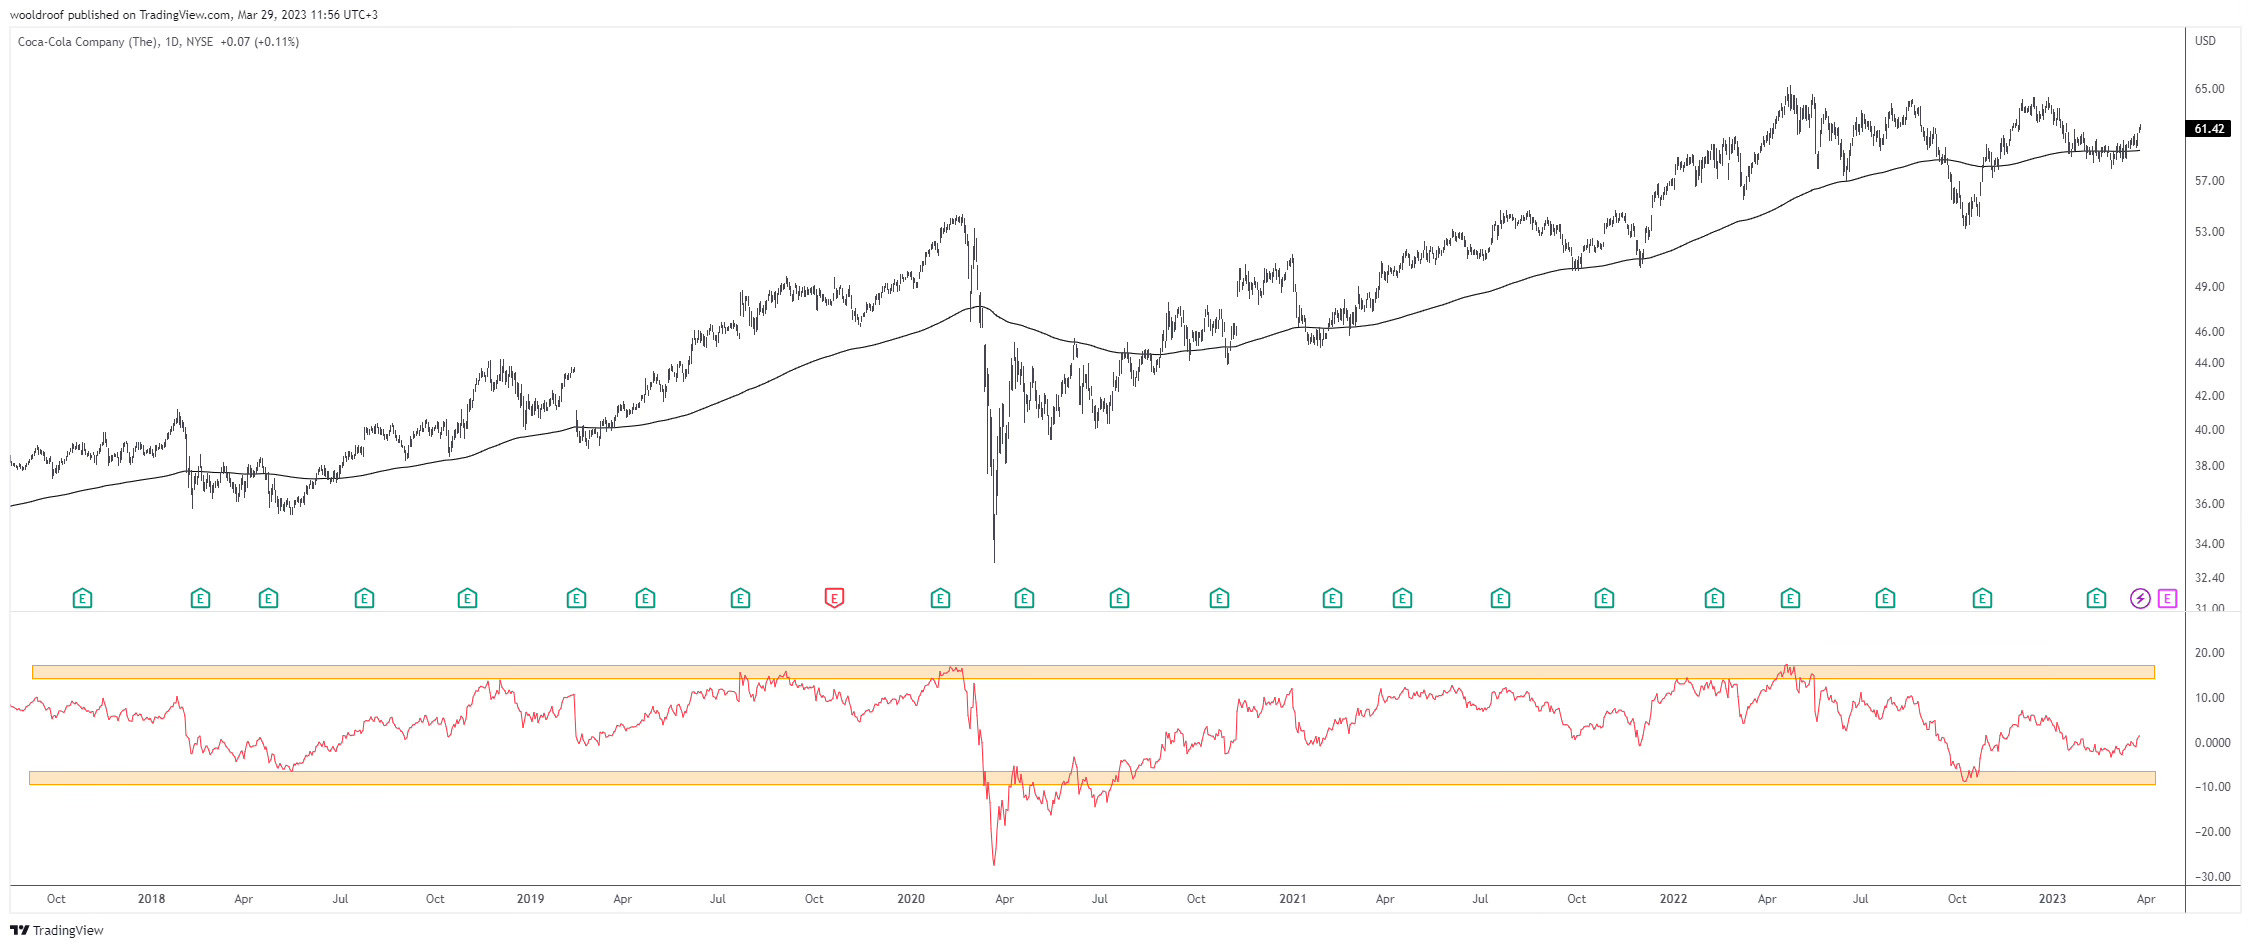
Aşırı Fiyat Hareketlerini Belirlemek: HO aşırı fiyat hareketleri için önemli bir göstergedir. Fiyat her zaman ortalamaya geri dönüş eğilimindedir. Bu nedenle, hareketli ortalamadan sapma, fiyatların olağan seyrinden ne kadar yükseldiğinin veya düştüğünün bir ölçüsüdür. Ortalamaya geri dönme olasılığı yüksek olduğundan, bu sapma trendle veya trende karşı trade etmek için bir fırsat haline gelir. Her ne kadar trende karşı hareket etmek riskli olsa da bazı traderlar ortalamaya geri çekilmelerde trend yönünde pozisyon almak konusunda oldukça heveslidir. Burada Tradingview kullananlar için bir indikatör önerebilirim. Muhtemelen diğer platformlarda da benzeri indikatörler yazılmıştır. 'Percentage Distance From Moving Average' indikatörü ile kullandığınız ortalamadan yüzde olarak +- ne kadar uzaklaştığınızı izleyebilir ve takip ettiğiniz enstrümanın geçmişte HO'dan ne kadar uzaklaştığında tepki vermeye başladığını görebilirsiniz. Özellikle kar alma noktalarını belirlemek veya geri çekilmelerin genellikle nerede tamamlandığını görebilmek için önemli bir HO ortalama kullanma yöntemidir.
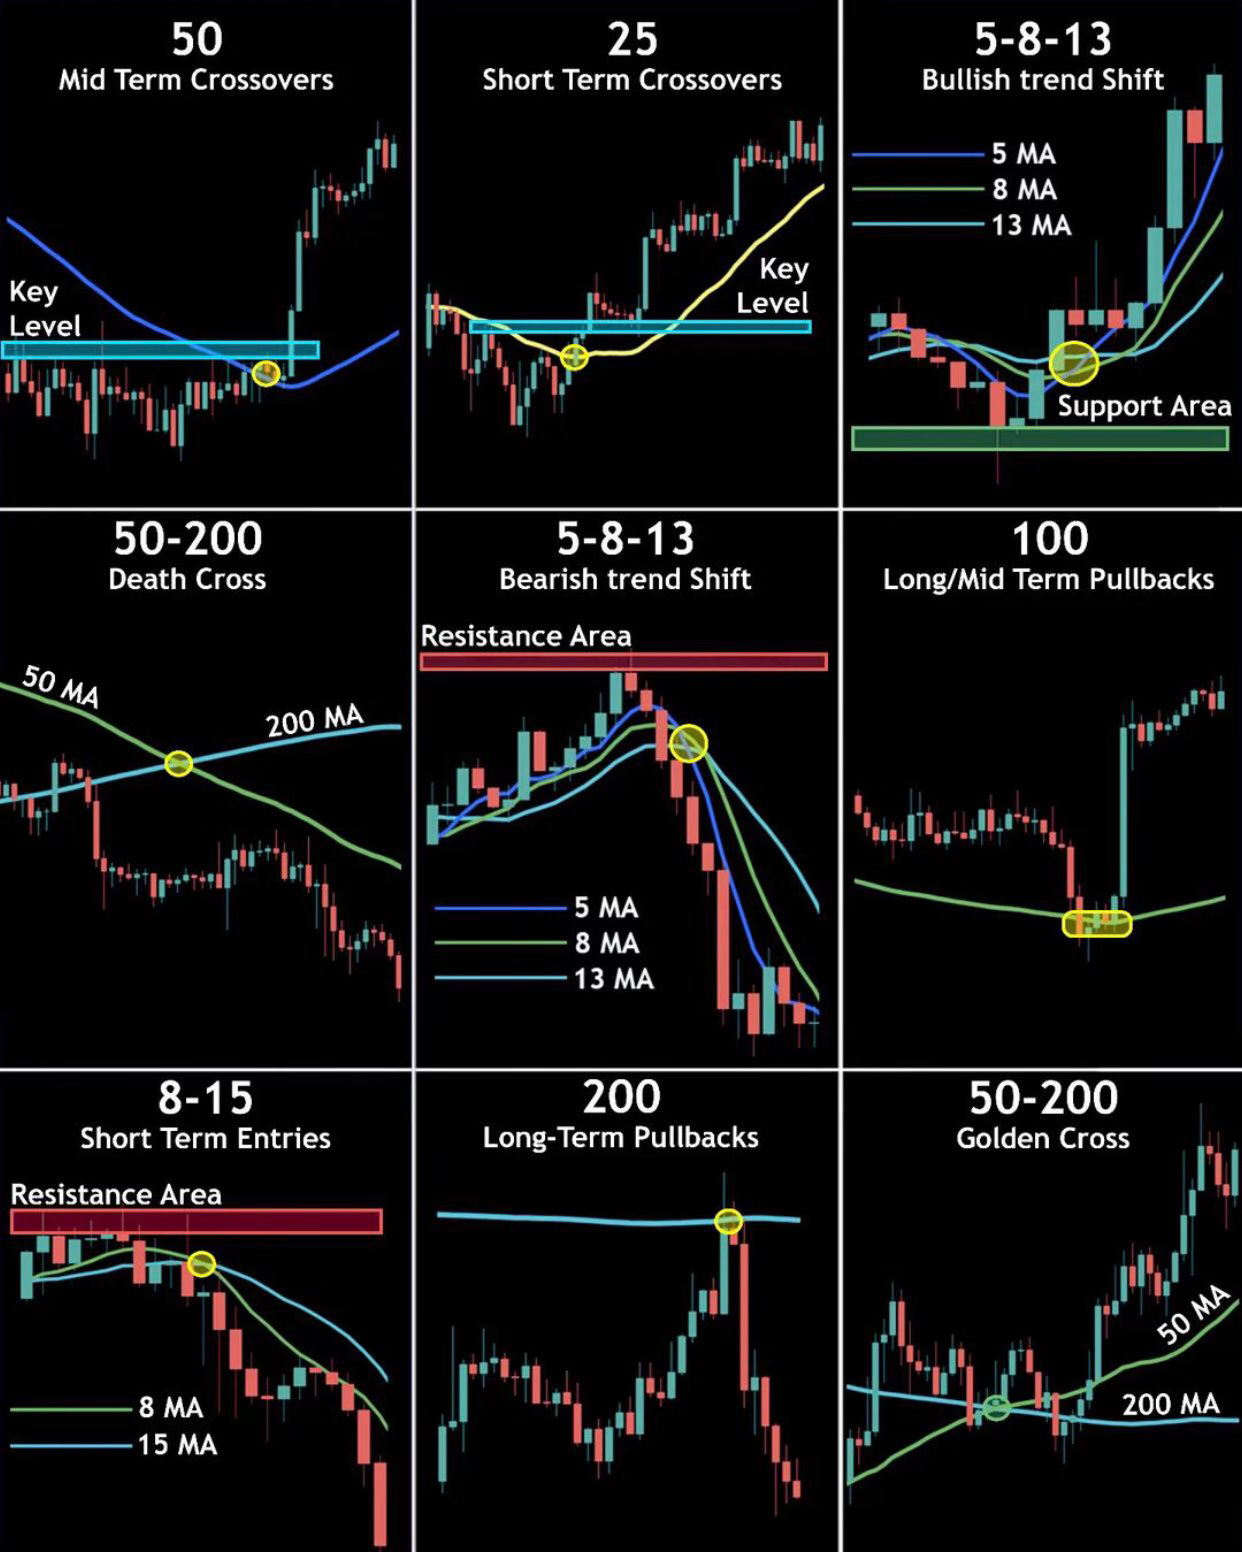
Al-Sat Sinyal Noktası Belirlemek: Bu yöntem birçok teknik analist tarafından al-sat sinyali üretmek amacıyla kullanılmaktadır. En yaygın kullanımı 3 şekilde oluyor. Fiyatın HO'yı geçmesi ile, Kısa-Uzun vadeli 2 HO'nın birbirini kesmesiyle veya 3. bir kısa vadeli HO'nun daha uzun vadeli iki HO'yu kesmesiyle sinyaller oluşabiliyor. Örnekte bu yöntemin birçok kullanım şeklini görebilirsiniz.
Sevgiler,
Çağan
Purposes of Using Moving Averages
Moving averages (MA) are one of the oldest tools used by technical analysts. Daily fluctuations in financial instruments can be quite wide over long periods. The main reason for using moving averages is to smooth these fluctuations and help investors focus on the trend that is most suitable for their timeframe. If, as a technical analyst, you decide to use moving averages in your charts, there are three fundamental questions you need to answer to make the most effective use of MAs:
Which type of moving average should I use?
How many periods should the moving average cover?
What is the purpose of adding the moving average or averages to my chart?
You won’t find answers to these questions from me or any other technical analyst. As always, the key is to find the answers that best suit your strategy.
I don't want to dwell too much on the first two questions because there are limitless sources of information on these topics on the internet and in books. Here’s a brief summary of what I have to say: The answer to "Which type of MA should I use?" depends on which data points in the time series are more important according to your strategy. For example, if you believe that the last 2-3 days' data is more important in a 10-period MA, you should use the type of MA that gives more weight to the most recent days. If you believe all data points are equally important, a simple moving average will suffice. The most important thing here is to understand the calculation method of an MA before deciding to use it. Adding a line to your charts without knowing where it comes from and how it is calculated will not bring you any benefit. The answer to "How many periods should the MA cover?" lies in your trading strategy. Depending on the timeframe you are trading in, it’s your job to choose an appropriate average. Commonly used averages in the market are as follows:
Short-term: 5-20 periods Medium-term: 10-50 periods Long-term: 50-200 periods
Now, let’s get to the topic I want to detail: "What is the purpose of adding the moving average or averages to my chart?" While each of the choices you make regarding the above questions has its own advantages and disadvantages, you will agree that our main interest is not how to calculate the moving average, but how to use them to make money. Moving averages help technical analysts in four fundamental ways: Determining the Trend, Identifying Support and Resistance, Detecting Overbought and Oversold Conditions, and Generating Buy-Sell Signals.
Determining the Trend: One of the most common uses is trend determination. The main goal here is to compare the current price with the moving average representing the investor's timeframe. For example, many medium-to-long-term investors use the 200-day moving average. If the financial instrument's price is above the 200-day MA, the trend is considered upward. Conversely, if the price is below the 200-day MA, the trend is considered downward.
You can see that the long-term average in the example tends to follow the trend quite well. A MA can be used to identify when a trend is potentially changing direction. Although a MA helps us distinguish a trend, it does so after the trend has started. Therefore, it is a lagging indicator.
Identifying Support and Resistance: If you can determine the MA that best suits your strategy and timeframe, this MA will generally act as support or resistance in your system. You can see how the long-term average works as support and resistance in the example. Support and resistance are the starting points of many technical analysis strategies, so clearly identifying these areas is golden for me.

Detecting Overbought and Oversold Conditions: A MA is an important indicator of overbought and oversold conditions. The price always tends to return to the average. Therefore, deviation from the moving average is a measure of how far prices have risen or fallen from their normal course. Since the likelihood of returning to the average is high, this deviation becomes an opportunity to trade with or against the trend. Although trading against the trend is risky, some traders are eager to take positions in the trend direction during pullbacks to the average. Here, I can recommend an indicator for TradingView users. Similar indicators are likely available on other platforms as well. The 'Percentage Distance From Moving Average' indicator allows you to track how far you are from the average in percentage terms and see how far the instrument typically reacts from the MA in the past. It is a crucial method for using a MA, especially to determine take-profit points or to see where pullbacks generally complete.

Generating Buy-Sell Signals: This method is used by many technical analysts to generate buy-sell signals. The most common use occurs in three ways: when the price crosses the MA, when two short-long term MAs cross each other, or when a third short-term MA crosses the two longer-term MAs.
Cheers!
Cagan