
Teknik Analizde 'Base' Kavramına Bakış Açım
Coffee Break Letters #008 - 29.05.2024


Herkese merhaba,
Bazı paylaşımlarımda "base'in sağı ve solu" gibi terimler kullanıyorum. Bu, teknik analiz literatüründe çok karşılaşmayacağınız, belki de biraz kaba bir tabir; ancak grafiklere bakışımı kolaylaştırmak için kullandığım, kendimce oldukça kullanışlı bulduğum bir tabir. Ne demek istediğimi çok sade bir şekilde anlatmaya çalışacağım.
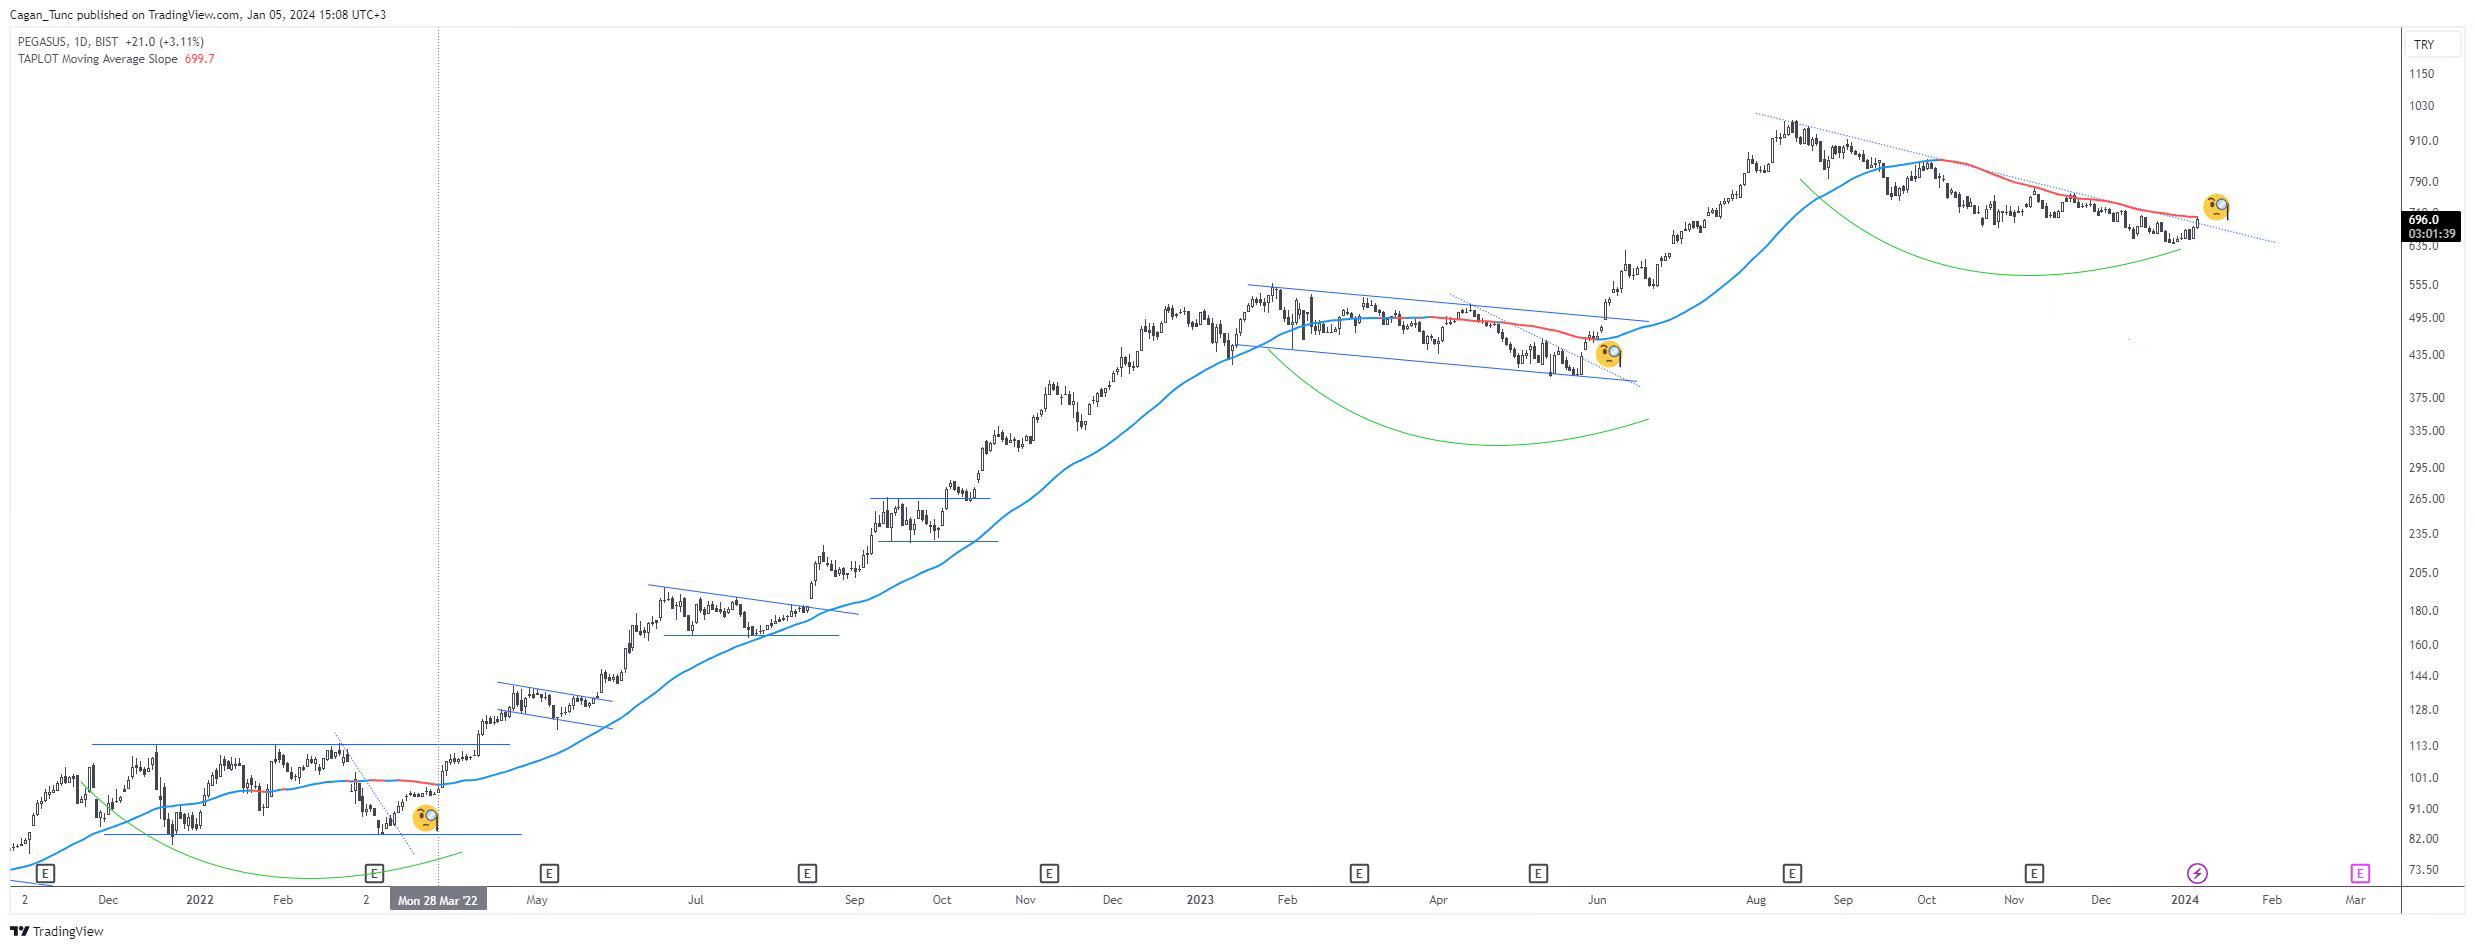
Bir hisse "base" oluştururken, yani konsolidasyon sürecine girdiği zaman, bu süreci base'in sağ ve sol tarafı olmak üzere iki ana faza ayırarak takip ediyorum. Bir hisse "base" oluştururken farklı karakteristik özellikler sergilese de, temelde benim dikkatimi çekmesi için gereken ortak özelliklerden biri (ve en önemlisi), sol tarafta gerçekleşen hacim-fiyat hareketleridir. Bu bölgede pozitif bir tablo gördüğüm takdirde, base sağ tarafa geçiş yaptığında (ki bu benim için genellikle fiyatın MA-50 üzerine çıkması ve/veya belirgin bir kısa vadeli düşüş trendini kırması olarak değerlendirilebilir (siz kendinize göre bir sistem kurabilirsiniz)) göstereceği güçlenme çok önemlidir. Benim için base'in sağ tarafa geçmesi kesinlikle bir alım sinyali değildir. Alım sinyali, bu bölgede hissenin kendini kanıtlayıp güçlenebilmesi ve uygun bir risk-kazanç oranı sunması ile gelecektir. Paylaştığım grafik örneğini inceleyebilirsiniz...
Sevgiler,
Çağan
My Perspective on the Concept of 'Base' in Technical Analysis
Hello everyone,
In some of my posts, I use terms like "the right and left of the base." This might not be a term you encounter often in technical analysis literature; however, it's a somewhat crude term I find quite useful for simplifying my perspective when looking at charts. I'll try to explain what I mean in a very straightforward manner.
When a stock forms a "base," i.e., enters a consolidation phase, I track this process by dividing it into two main phases: the right and left of the base. While different stocks may exhibit different characteristic features when forming a base, one common feature (and the most important one) that catches my attention is the volume-price movements on the left side. If I see a positive picture in this area, it's crucial for me when the base transitions to the right side (which I typically evaluate as the price crossing above the MA-50 and/or breaking a significant short-term downtrend (you can develop your own system)). The strength it shows upon transitioning to the right side is very important. However, for me, the transition of the base to the right side is not necessarily a buy signal. A buy signal will come when the stock proves itself and strengthens in this area, offering an appropriate risk-reward ratio. You can examine the shared chart example for reference...
Cheers!
Cagan